Most sports stats are not bell curves. Player points, threes made and runs scored all have a long tail on the high side. That changes what the average tells you, which model you should use, and how to read a line set near the average.
Everything below comes from the bayesRatings game database: ESPN final scores and box scores, regular season only, with all-star and other exhibition games removed.
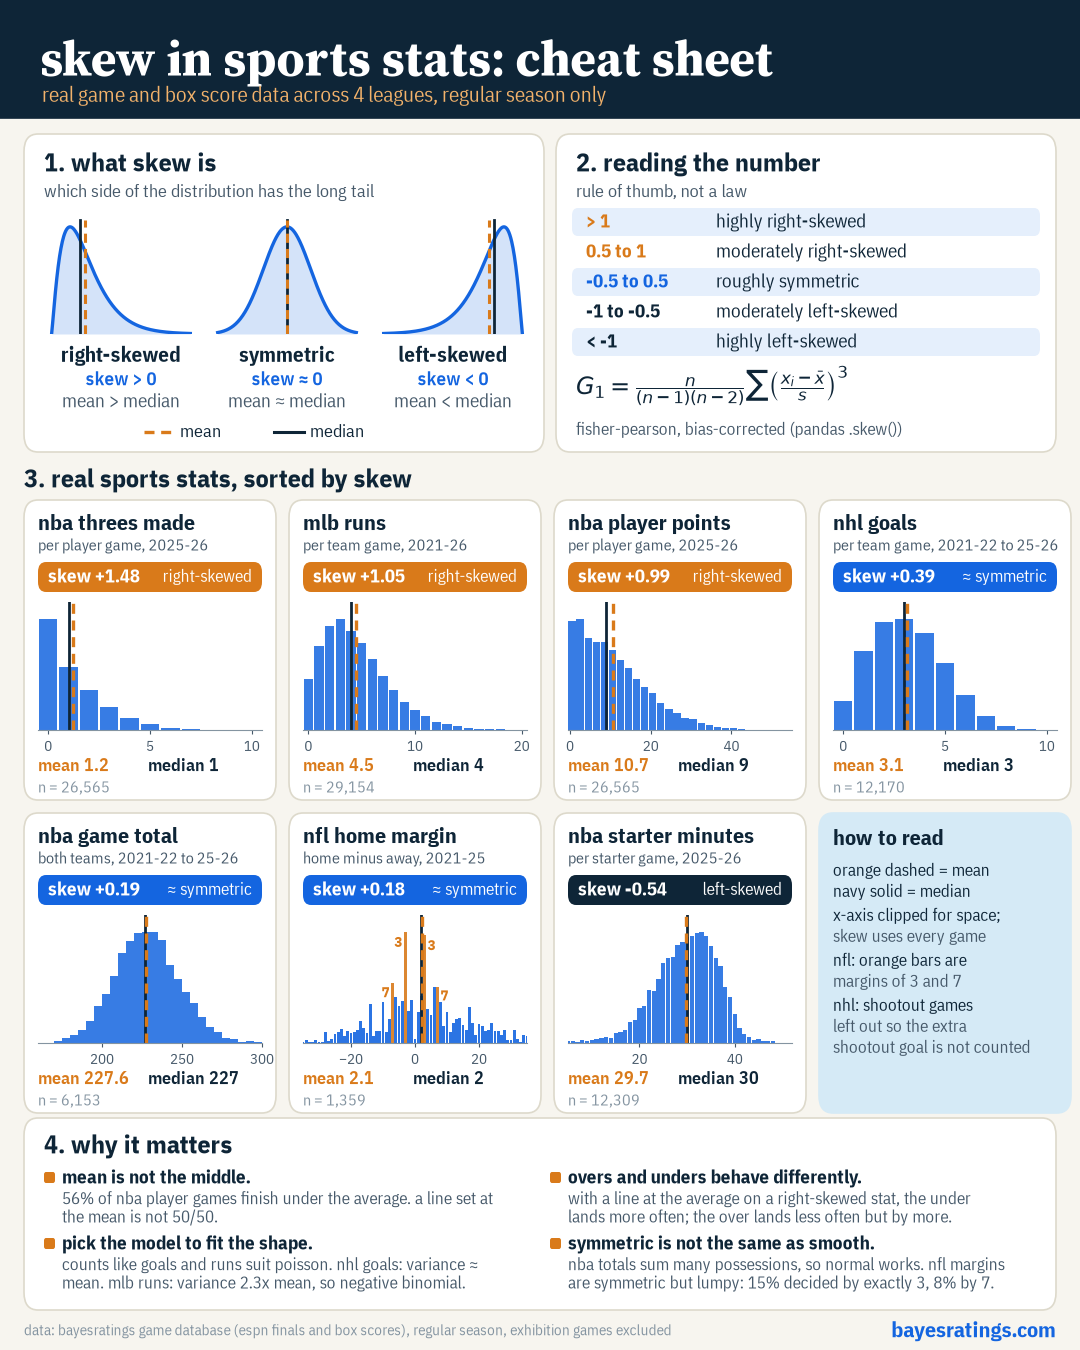
What skew is
Skew measures which side of a distribution has the long tail.
- Right skew (positive): most games cluster low, a few run high. The mean sits above the median.
- Left skew (negative): most games cluster high, a few run low. The mean sits below the median.
- Near zero: the two sides roughly balance. Mean and median are close.
A common rule of thumb: above 1 is highly skewed, 0.5 to 1 is moderate, and -0.5 to 0.5 is roughly symmetric. We use the bias-corrected Fisher-Pearson coefficient, the same number pandas .skew() returns.
Seven real stats, sorted by skew
| Stat | Seasons | Games (n) | Mean | Median | Skew |
|---|---|---|---|---|---|
| NBA threes made, per player game | 2025-26 | 26,565 | 1.23 | 1 | +1.48 |
| MLB runs, per team game | 2021 to 2026 | 29,154 | 4.46 | 4 | +1.05 |
| NBA points, per player game | 2025-26 | 26,565 | 10.71 | 9 | +0.99 |
| NHL goals, per team game | 2021-22 to 2025-26 | 12,170 | 3.12 | 3 | +0.39 |
| NBA game total | 2021-22 to 2025-26 | 6,153 | 227.57 | 227 | +0.19 |
| NFL home margin | 2021 to 2025 | 1,359 | 2.06 | 2 | +0.18 |
| NBA starter minutes | 2025-26 | 12,309 | 29.72 | 30 | -0.54 |
Player games count only if the player logged at least one minute. NHL games decided by shootout are left out so the shootout goal does not count as a scored goal.
The pattern is simple. Stats with a floor at zero and a low average skew right: a player can’t score fewer than zero threes, but he can make eight. Starter minutes skew left for the opposite reason. There is a ceiling near 48, and injuries, foul trouble and blowouts pull games down.
Count data and overdispersion
Runs and goals are counts. The default model for counts is Poisson, which has one assumption that matters: the variance equals the mean. You can check that directly.
| Stat | Mean | Variance | Variance / mean |
|---|---|---|---|
| NHL goals per team game | 3.12 | 3.19 | 1.02 |
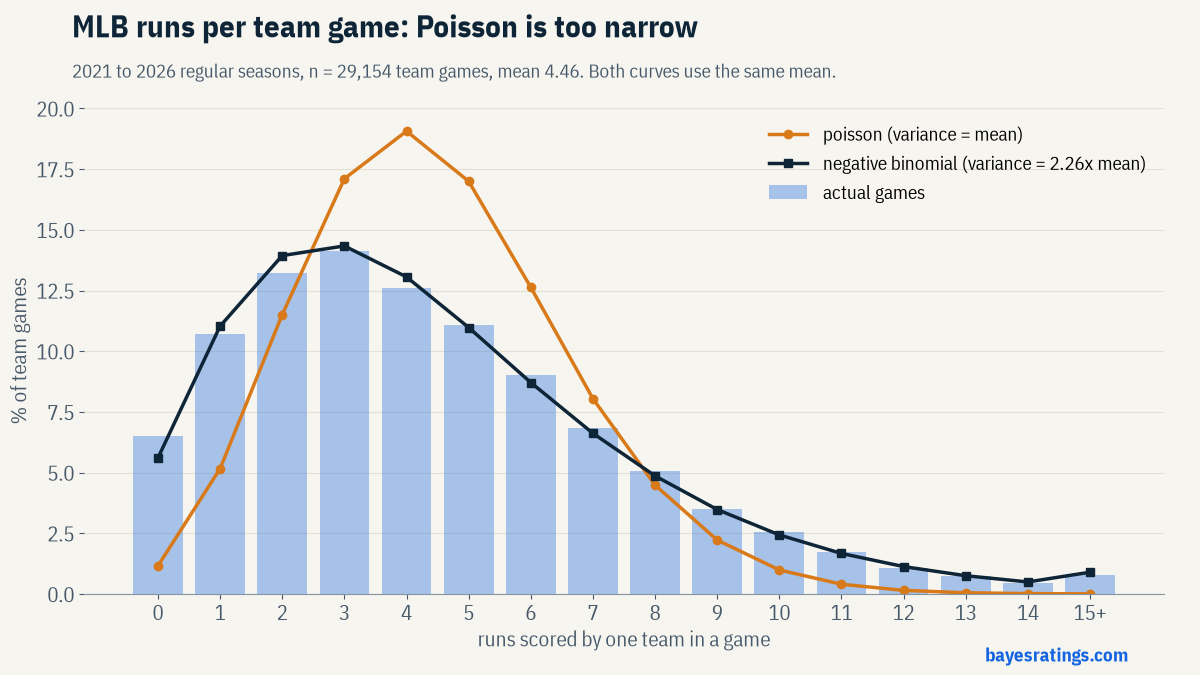
| MLB runs per team game | 4.46 | 10.10 | 2.26 |
NHL goals pass. MLB runs have more than twice the spread Poisson expects. This is called overdispersion, and the negative binomial handles it with a second parameter that lets variance run above the mean.
It is not just good teams mixed with bad ones. Within each MLB team’s own season, the median variance-to-mean ratio is 2.22 (180 team seasons). For NHL teams it is 0.98 (160 team seasons).
Here is what that does to the tails for MLB, using the same mean of 4.46:
| Runs by one team | Actual | Poisson | Negative binomial |
|---|---|---|---|
| 0 (shut out) | 6.5% | 1.2% | 5.6% |
| 10 or more | 7.3% | 1.6% | 7.4% |
Poisson says a team gets shut out about once every 86 games. It actually happens about once every 15. Negative binomial gets close on both ends. For NHL, Poisson is already close: 5.4% of team games end with zero goals, against 4.4% under Poisson.
Big sums smooth out
NBA game totals barely skew (+0.19). A total is the sum of a full game of possessions from two teams, and sums of many small pieces tend toward a bell shape. The data backs that up: 68.5% of totals land within one standard deviation (20.2 points) of the mean and 95.3% within two. A normal curve says 68.3% and 95.4%. For NBA totals, a normal model is a fair place to start.
Symmetric is not the same as smooth
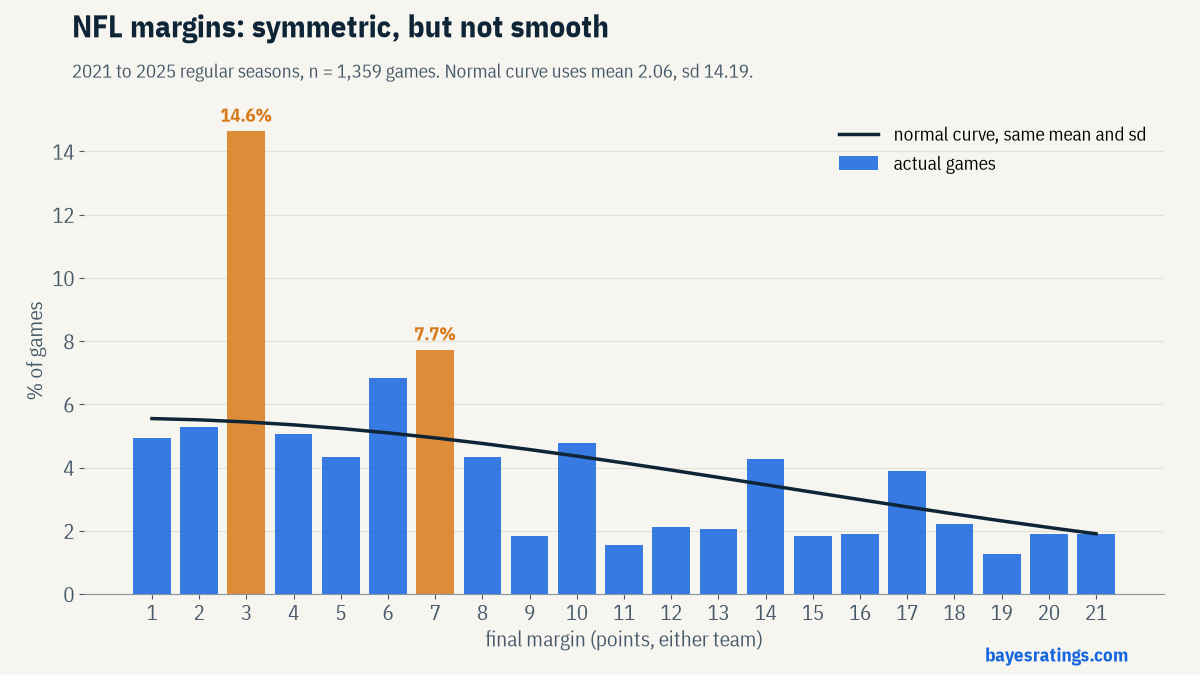
NFL home margins have almost no skew (+0.18), and the mean (2.06) and median (2) nearly match. By the skew number alone, a normal curve looks fine. It isn’t.
| Final margin | Actual | Normal curve |
|---|---|---|
| Exactly 3 | 14.6% | 5.4% |
| Exactly 7 | 7.7% | 4.9% |
Field goals and touchdowns with extra points stack results on 3 and 7. Together they account for 22.4% of games. A smooth curve with the right mean and spread still misses the most common outcomes. Skew tells you about the tails, not about lumps in the middle.
Why a line at the average isn’t 50/50
On a right-skewed stat, the average sits above the typical game. If you put a line exactly at the average, the under lands more often. When the over lands, it lands by more.
| Stat | Mean | Under the mean | Avg. miss when under | Avg. clear when over |
|---|---|---|---|---|
| NBA threes made | 1.23 | 66.9% | 0.87 | 1.76 |
| NHL goals | 3.12 | 60.1% | 1.20 | 1.81 |
| MLB runs | 4.46 | 57.2% | 2.19 | 2.92 |
| NBA player points | 10.71 | 56.0% | 6.16 | 7.85 |
| NBA game total | 227.57 | 50.6% | 15.8 | 16.2 |
The NBA total is the control: no skew, close to 50/50, and misses of about the same size on both sides.
To be clear, this describes the shape of the data pooled across all players and teams. We have not checked it against sportsbook lines, which are set per player and per game, and it is not a betting edge. The point is narrower: an average alone doesn’t tell you where the middle is.
In practice, sportsbooks set player lines near the median, not the mean. They care about splitting the outcomes, not how far over or under a result lands. On a right-skewed stat the median sits below the average, so betting the over because a line is under a player’s average is a common mistake.
Monte Carlo depends on the distribution
Simulations are useful, but a Monte Carlo sim only reruns whatever model you give it. The important part is the distribution underneath.
To show it, we simulated 200,000 MLB games twice, using the same 4.46 runs per team both times. One run drew each team’s score from Poisson, the other from the negative binomial fit above.
| MLB game total | Actual | Poisson sim | Negative binomial sim |
|---|---|---|---|
| 15 runs or more | 11.5% | 3.9% | 11.3% |
| 4 runs or fewer | 14.9% | 5.8% | 15.6% |
| Standard deviation | 4.49 | 2.99 | 4.49 |
Same mean, same number of sims, very different answers. The Poisson sim misses about two thirds of the high-scoring games. More simulations would not fix that. Picking the right distribution does.
(This sim is deliberately simple: every team gets the league average, and the two teams score independently. A real model sets each team’s mean from its ratings. The lesson about shape holds either way.)
Takeaways
- Check mean against median before trusting an average.
- Count stats with variance near the mean (NHL goals) fit Poisson. Counts with more spread (MLB runs) fit negative binomial.
- Large sums like NBA totals look normal.
- A skew near zero doesn’t mean smooth. Look for key numbers.
- A simulation is only as good as the distribution you feed it.