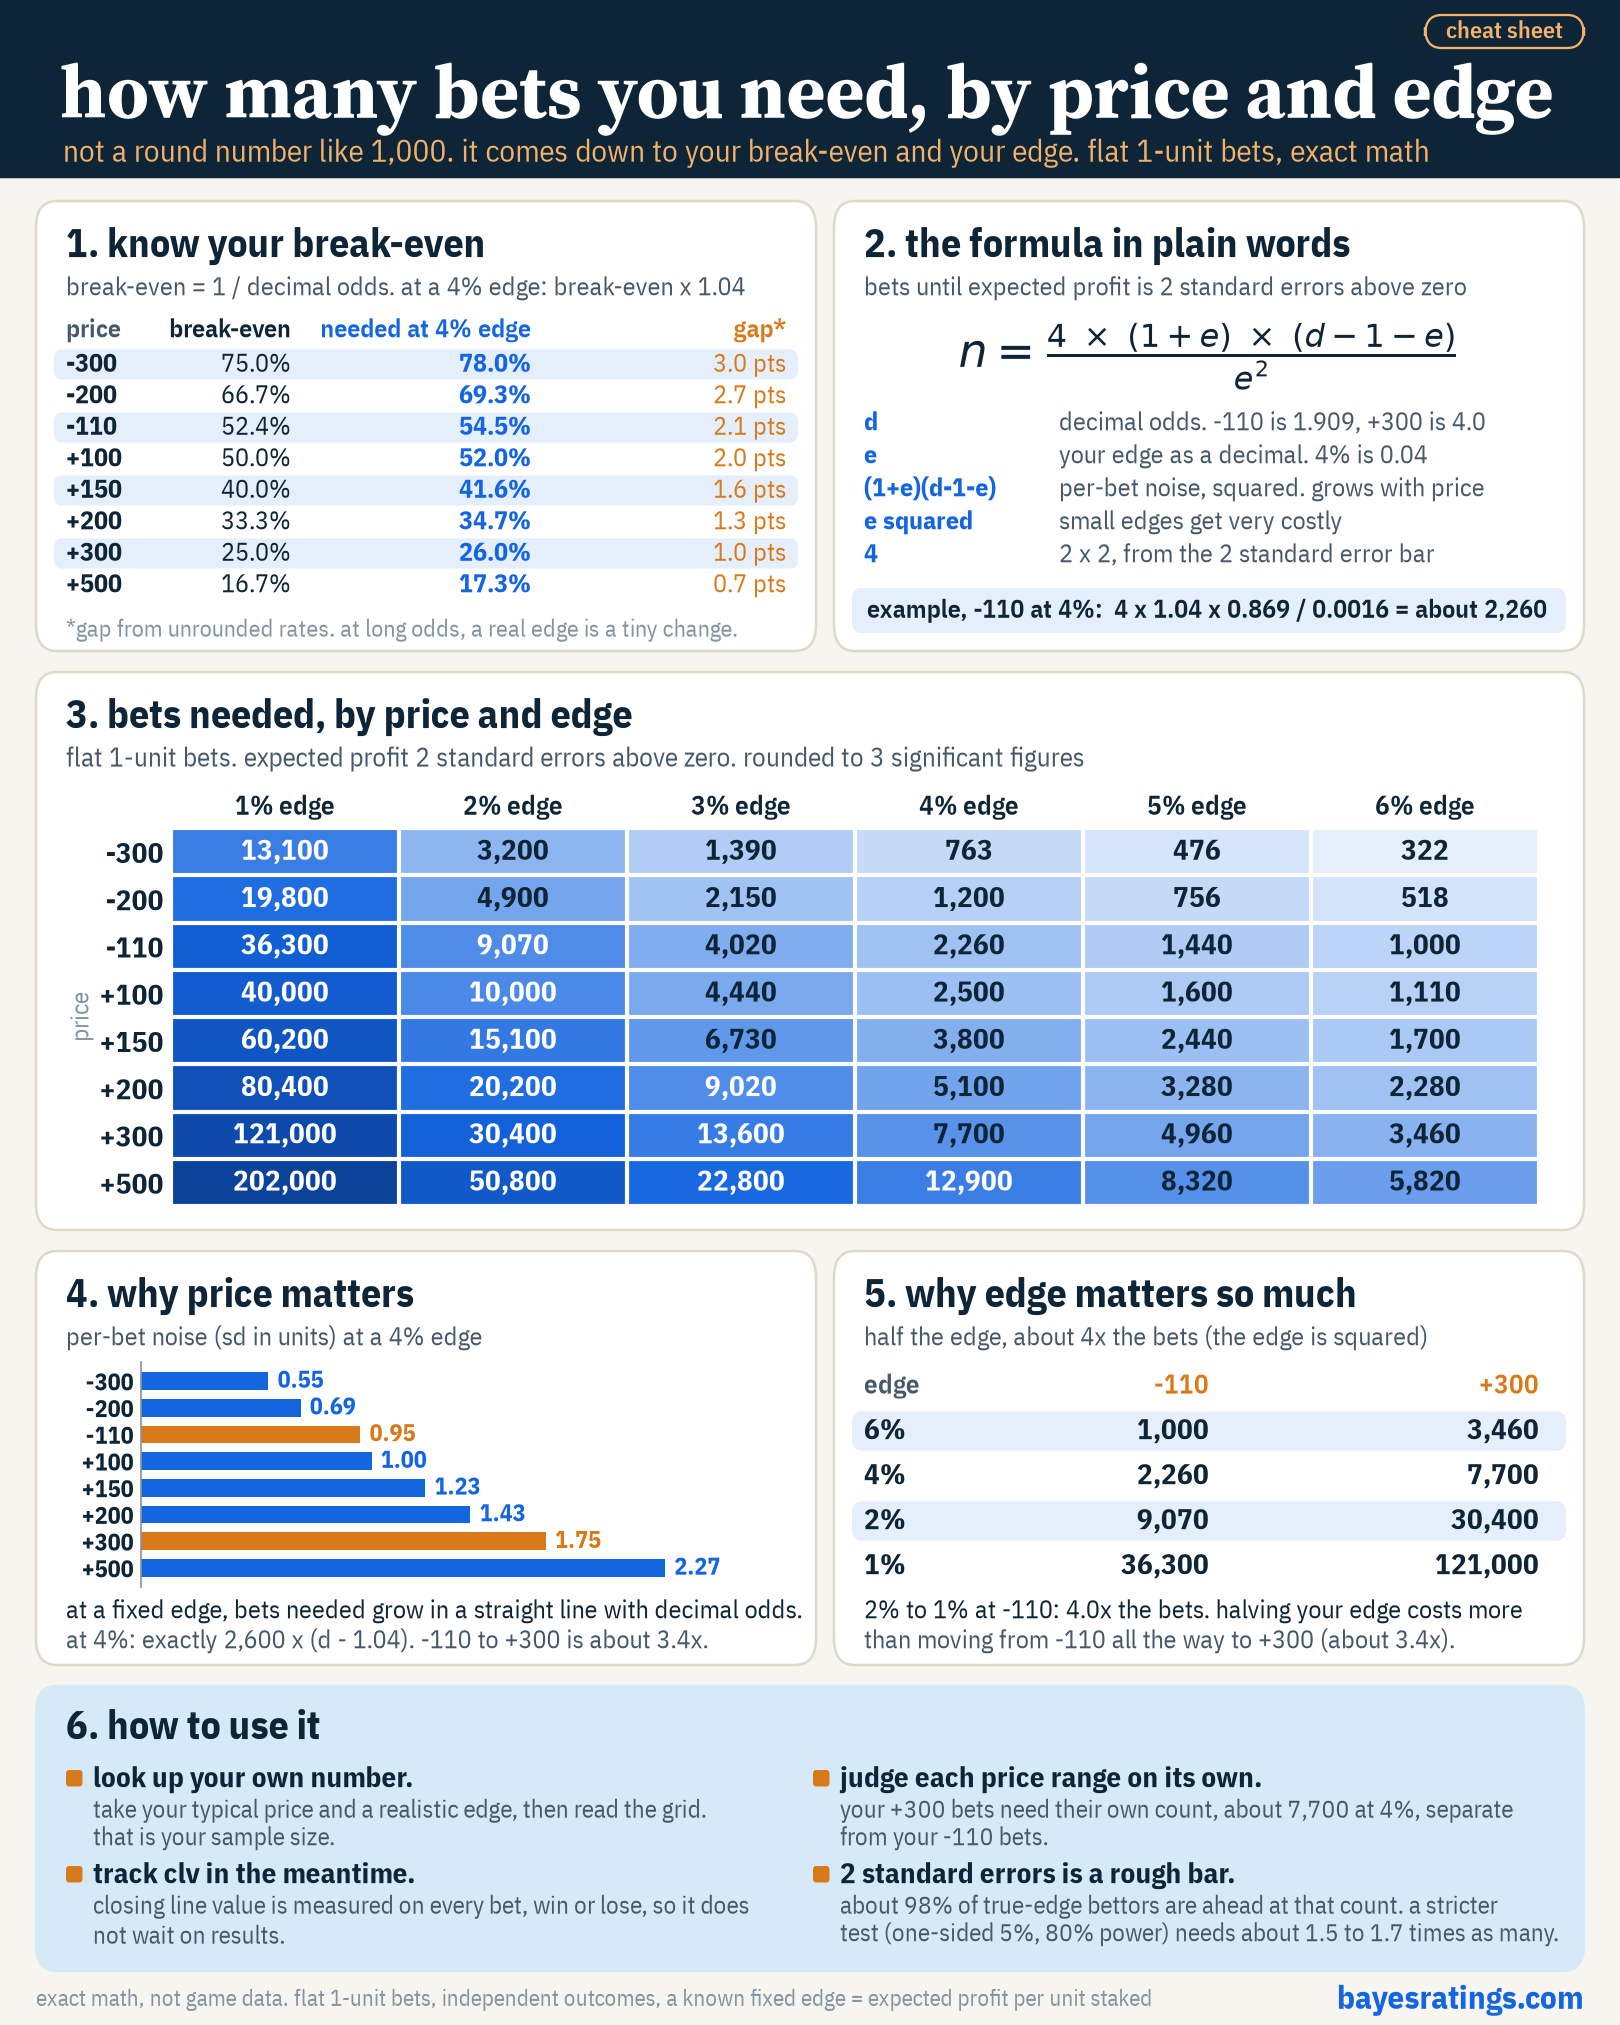
The number of bets you need before your record means anything depends on your price and your edge, not on a round number like 1,000. A 4% edge at -110 needs about 2,260 bets before the expected profit sits 2 standard errors above zero, while the same edge at +300 needs about 7,700.
A 2% edge at -110 needs about 9,070. This post shows where those numbers come from, gives a lookup table you can use for your own bets, and explains what the count does and does not tell you.
Everything here is exact math, not bayesRatings game data. Every bet is a flat 1-unit bet, and “edge” means expected profit per unit staked. A 4% edge means you expect to make 0.04 units per bet on average.
Step 1: know your break-even
Convert the American price to decimal odds, called d. A win returns d units for every unit staked, so the profit on a win is d minus 1.
- Negative prices: d = 1 + 100 / |price|. So -110 is 1 + 100/110 = 1.909.
- Positive prices: d = 1 + price / 100. So +300 is 4.0.
Your break-even win rate is 1 / d. To have an edge of e, you need to win (1 + e) / d of the time. At a 4% edge, that is the break-even rate times 1.04.
| Price | Break-even | Needed at a 4% edge | Gap (points) |
|---|---|---|---|
| -300 | 75.0% | 78.0% | 3.0 |
| -200 | 66.7% | 69.3% | 2.7 |
| -110 | 52.4% | 54.5% | 2.1 |
| +100 | 50.0% | 52.0% | 2.0 |
| +150 | 40.0% | 41.6% | 1.6 |
| +200 | 33.3% | 34.7% | 1.3 |
| +300 | 25.0% | 26.0% | 1.0 |
| +500 | 16.7% | 17.3% | 0.7 |
The gap column is computed from the unrounded rates, so it can differ by 0.1 from subtracting the rounded columns. At -110, a 4% edge is 2.1 points above break-even. At +300, it is 1.0 point. At long odds, a real edge is a very small change in win rate, which is the first hint that it takes longer to see.
Step 2: the formula and where it comes from
Each bet has two outcomes. You win d minus 1 units, or you lose 1 unit. The farther apart those outcomes are, the bigger the swing on every bet. At -110 the outcomes are +0.91 and -1. At +300 they are +3 and -1.
The size of that swing is the per-bet standard deviation (SD). For a true win rate p, it is d times the square root of p(1 - p). With a little algebra, that becomes the square root of (1 + e)(d - 1 - e).
Over n bets, your expected profit grows with n, but the noise only grows with the square root of n. The noise around your total is called the standard error, and it equals the per-bet SD times the square root of n. A common planning bar is the point where your expected profit is 2 standard errors above zero:
n x e = 2 x SD x (square root of n)
Solve for n and you get:
bets needed = 4 x (1 + e) x (d - 1 - e) / e squared
- (1 + e) x (d - 1 - e) is the per-bet noise, squared. It grows with the price.
- e squared sits underneath, so small edges get very expensive.
- 4 is 2 squared, from the 2 standard error bar.
Worked example, -110 at a 4% edge: 4 x 1.04 x 0.869 / 0.0016 = about 2,260 bets.
Step 3: look up your number
Here is the full grid, rounded to 3 significant figures:
| Price | 1% | 2% | 3% | 4% | 5% | 6% |
|---|---|---|---|---|---|---|
| -300 | 13,100 | 3,200 | 1,390 | 763 | 476 | 322 |
| -200 | 19,800 | 4,900 | 2,150 | 1,200 | 756 | 518 |
| -110 | 36,300 | 9,070 | 4,020 | 2,260 | 1,440 | 1,000 |
| +100 | 40,000 | 10,000 | 4,440 | 2,500 | 1,600 | 1,110 |
| +150 | 60,200 | 15,100 | 6,730 | 3,800 | 2,440 | 1,700 |
| +200 | 80,400 | 20,200 | 9,020 | 5,100 | 3,280 | 2,280 |
| +300 | 121,000 | 30,400 | 13,600 | 7,700 | 4,960 | 3,460 |
| +500 | 202,000 | 50,800 | 22,800 | 12,900 | 8,320 | 5,820 |
Find your typical price, pick a realistic edge, and read across. That is roughly how many bets it takes before a real edge of that size shows up as profit for about 98% of bettors with that edge.
Price vs edge
Price sets the noise. Here is the per-bet SD at a 4% edge:
| Price | Per-bet SD (units) |
|---|---|
| -300 | 0.55 |
| -200 | 0.69 |
| -110 | 0.95 |
| +100 | 1.00 |
| +150 | 1.23 |
| +200 | 1.43 |
| +300 | 1.75 |
| +500 | 2.27 |
At a fixed edge, the count grows in a straight line with decimal odds. At 4%, it is exactly 2,600 x (d - 1.04). Moving from -110 to +300 takes about 3.4 times as many bets.
Edge matters even more. Because the edge is squared, halving it takes about 4 times as many bets:
| Edge | -110 | +300 |
|---|---|---|
| 6% | 1,000 | 3,460 |
| 4% | 2,260 | 7,700 |
| 2% | 9,070 | 30,400 |
| 1% | 36,300 | 121,000 |
Going from a 2% edge to a 1% edge at -110 takes 4.0 times the bets. That is a bigger jump than moving from -110 all the way to +300 at the same edge.
What the 2 standard error bar means, and what it doesn’t
This number is easy to oversell, so here is exactly what it says.
- About 98% are ahead. At the bets-needed count, about 98% of bettors with that true edge are in profit.
- Only about half clear the bar on their own. The bar sits right at the expected result, so a real edge lands above it about as often as below. At this count, about half of true-edge bettors would have a result strong enough to pass a 2 standard error check.
- A stricter test needs about 1.5 to 1.7 times as many bets. If you want a one-sided test at the 5% level that a real edge passes 80% of the time, the count is about 1.5 to 1.7 times the grid number (about 1.58 at -110 and 1.55 at +300, using exact binomial math). For a 4% edge, that is about 3,560 bets at -110 and 11,900 at +300.
So treat the grid as a planning number for how long a real edge takes to show up. It is not proof that anyone has an edge.
For a sense of scale, the count is not reached by 1,000 bets in most of the grid. With a true 4% edge, the exact math says about 8.9% of bettors at -110 and 22.5% at +300 are still behind after 1,000 bets.
How to apply it to your own record
This is a way to read your own results, not a strategy.
- Split your record by price range. For example: heavy favorites, near even money, moderate plus money and longshots.
- Give each range its own count. Use that range’s typical price and the grid above. A +300 group needs its own count, about 7,700 bets at a 4% edge, no matter how many -110 bets you have.
- Compare win rate to break-even inside each range. A 27% win rate is above break-even at +300 and well below it at +150.
- Be careful with blended totals. At the same edge, a 50/50 mix of -110 and +300 needs a count between the two, so the blend does not tell you whether the +300 bets are working on their own. A single blended ROI also can’t show which range the edge comes from.
- Track closing line value (CLV) in the meantime. CLV compares the price you got with the final price before the game. It is measured on every bet, win or lose, so it does not wait on outcomes to settle. That makes it a useful earlier read alongside profit. This is a logical point about how CLV is measured, not a claim about how well it predicts results.
Caveats
- Flat stakes. Real bettors vary their stakes, which changes the noise.
- Independent bets. Bets on the same game or the same slate are correlated, which adds noise beyond what is shown here.
- A known, fixed edge. Real edges are unknown and change over time and across markets.
- One price per range. A real price range includes several prices, each with its own break-even and its own count.
- Normal approximation. The formula treats the total as roughly bell-shaped, which is close at these sample sizes.
Most of these make a real record noisier than this clean version, so treat the grid as a floor, not a target.
The takeaway is simple. Know your break-even, look up the count for your price and edge, and judge each price range against its own number.