We have spent a lot of these posts on probabilities and distributions: how often the home team wins, how skewed a betting record is, how much a season can swing by chance. A z-score is the simplest tool that ties those ideas together. It tells you where one value sits inside its distribution, in a unit that means the same thing everywhere.
This post works the formula by hand, then uses 620 real team seasons from the NBA, NFL, NHL and MLB to show why the same raw number can sit in very different places, when the usual percentile lookup works, and how a z-score connects to the standard error we used in earlier posts.
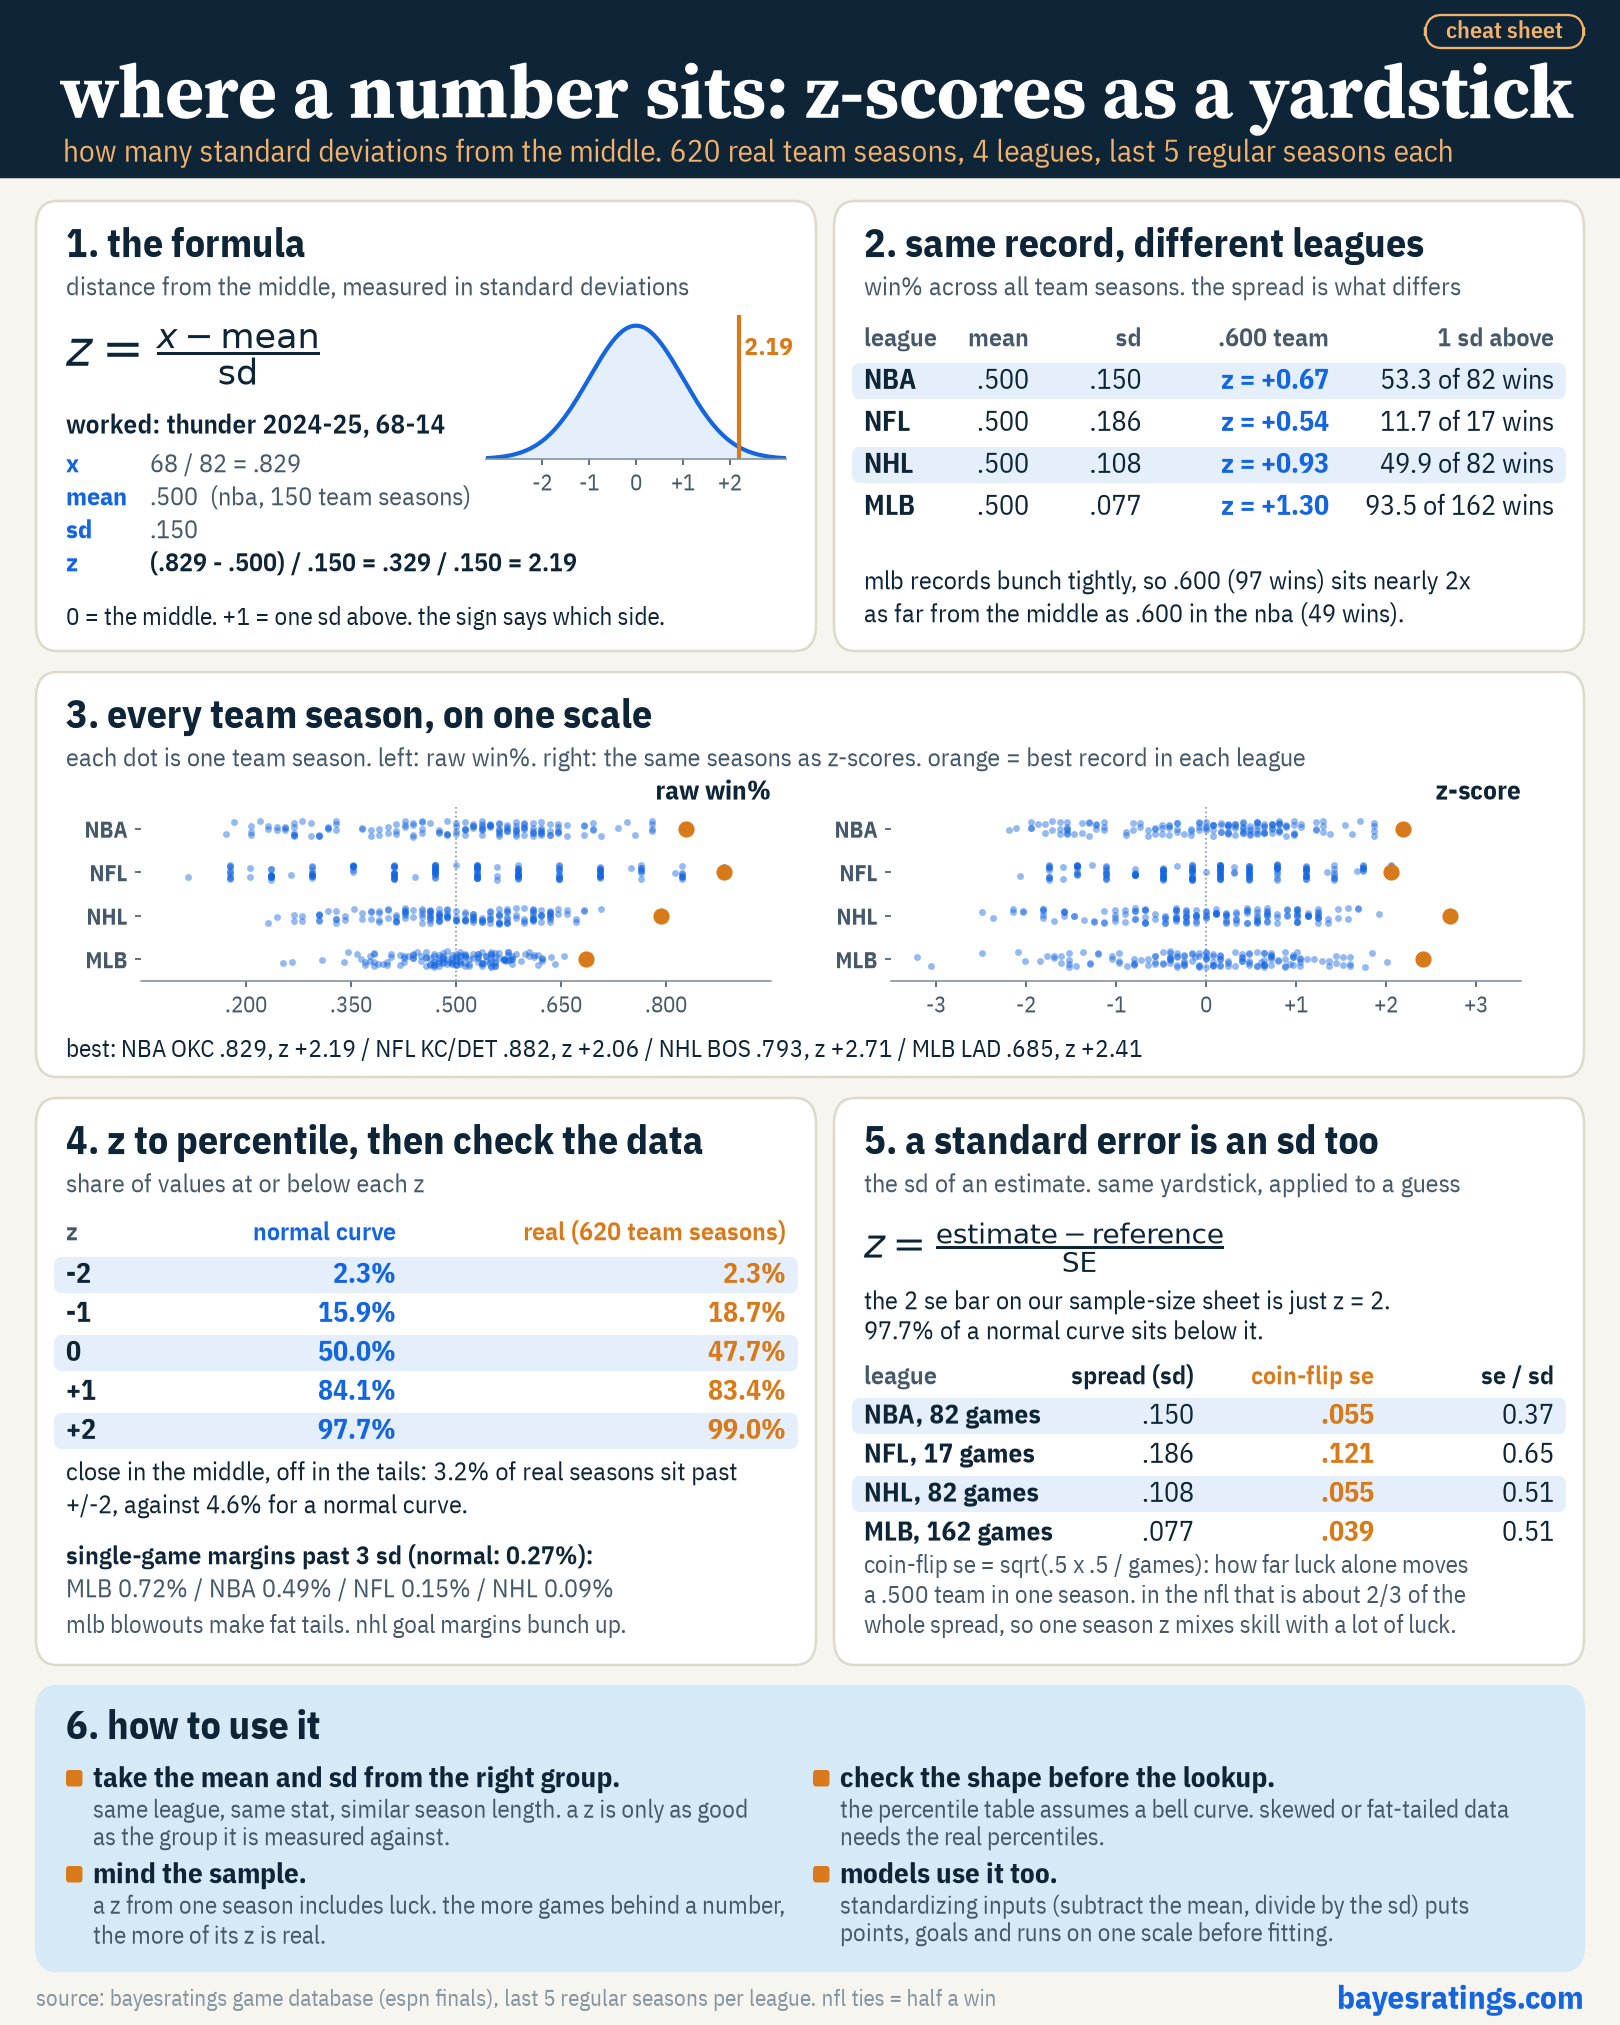
The formula
A z-score measures how far a value is from the middle of its group, counted in standard deviations:
z = (x - mean) / sd
- x is the value you care about.
- mean is the average of the group.
- sd is the standard deviation of the group, a measure of how spread out the values are.
A z of 0 means the value is right at the mean. A z of +1 means it sits one standard deviation above the mean, and -1 means one below. The sign tells you which side, and the size tells you how far, in the group’s own units of spread.
That last part is the point. Subtracting the mean removes the “where is the middle” question. Dividing by the sd removes the “how wide is the spread” question. What is left is position.
A worked example
The 2024-25 Oklahoma City Thunder went 68-14. Their win percentage was:
68 / 82 = .829
Across the last five NBA regular seasons (2021-22 to 2025-26), there are 150 team seasons in our database. Their average win percentage is .500, which it has to be, since every game has one winner and one loser. Their standard deviation is .150.
So the Thunder’s z-score is:
z = (.829 - .500) / .150 = .329 / .150 = 2.19
The Thunder sat 2.19 standard deviations above the middle of the NBA. That number is the yardstick reading. It does not need any knowledge of basketball to interpret, and it can be laid next to a z from any other sport.
The same record means different things in different leagues
Here is the part that makes z-scores worth learning. Every league’s win percentages average .500, but they do not spread out the same way.
| League | Seasons | Team seasons | Mean | SD | A .600 team | 1 SD above the mean |
|---|---|---|---|---|---|---|
| NBA | 2021-22 to 2025-26 | 150 | .500 | .150 | z = +0.67 | 53.3 of 82 wins |
| NFL | 2021 to 2025 | 160 | .500 | .186 | z = +0.54 | 11.7 of 17 wins |
| NHL | 2021-22 to 2025-26 | 160 | .500 | .108 | z = +0.93 | 49.9 of 82 wins |
| MLB | 2022 to 2026 | 150 | .500 | .077 | z = +1.30 | 93.5 of 162 wins |
Take a .600 record. In MLB that is about 97 wins:
z = (.600 - .500) / .077 = 1.30
In the NBA, .600 is about 49 wins:
z = (.600 - .500) / .150 = 0.67
The raw number is identical. Its position is not. A .600 baseball team sits nearly twice as far from the middle of its league as a .600 basketball team, because baseball records bunch together much more tightly.
The last column reads the same idea the other way. A team one standard deviation above the middle wins about 53 games in the NBA but about 93 in MLB. “One sd above” is the same position on the yardstick, even though the raw records look nothing alike.
Every team season on one scale
Now compare the best record in each league over those five seasons:
| League | Best record | Win % | z |
|---|---|---|---|
| NBA | 2024-25 Thunder, 68-14 | .829 | +2.19 |
| NFL | 2024 Chiefs and Lions, both 15-2 | .882 | +2.06 |
| NHL | 2022-23 Bruins, 65 wins in 82 games | .793 | +2.71 |
| MLB | 2022 Dodgers, 111-51 | .685 | +2.41 |
By raw win percentage, the Dodgers have the lowest number on this list. By z-score, they sit further from their league’s middle than the Thunder or the two 15-2 NFL teams. The Bruins, whose 65 wins set the NHL record, sit furthest of all at +2.71.
For hockey we count any win, including overtime and shootout wins, as a win. The NHL standings use points instead, so the Bruins’ official mark is 65-12-5. Ties in the NFL count as half a win.
At the other end, the 2024 White Sox went 41-121, the most losses in the modern era. Their win percentage was .253, and their z-score is -3.21, the furthest from the middle of any of the 620 team seasons.
Notice that none of this is about calling a team unusual. It is just reading position. Once every season is on the same scale, you can line them up, sort them, or feed them into a model without the league’s own spread getting in the way.
From z to percentile, and why you should check
If the values follow a normal curve (the bell shape), a z-score converts directly to a percentile. The share of values at or below a given z is a fixed number:
| z | Normal curve: share at or below | Real team seasons: share at or below |
|---|---|---|
| -2 | 2.3% | 2.3% |
| -1 | 15.9% | 18.7% |
| 0 | 50.0% | 47.7% |
| +1 | 84.1% | 83.4% |
| +2 | 97.7% | 99.0% |
The right-hand column is the real check. For each of the 620 team seasons, we computed its z inside its own league, then counted how many land at or below each mark.
In the middle, the normal curve is a good guide. At the edges it is less so. Only 3.2% of real team seasons sit beyond plus or minus 2, against 4.6% for a normal curve. The top end is thinner than the bell shape predicts: 1.0% of seasons sit above +2, where a normal curve would put 2.3%.
Single-game scoring margins show the opposite problem in some sports. For each league we took every regular-season game’s home margin, turned it into a z-score, and counted how many land more than 3 standard deviations from the mean. A normal curve puts 0.27% there.
- MLB: 0.72%
- NBA: 0.49%
- NFL: 0.15%
- NHL: 0.09%
Baseball run margins have fat tails. Blowouts happen more often than the bell curve allows. Hockey goal margins are the reverse: they bunch up near zero, so the extremes are rarer than a normal curve says.
This is the same lesson as our earlier post on skew. The normal lookup table is a shortcut, and it is only as good as the shape of your data. When you have the data, count the real percentiles instead of trusting the table.
A standard error is a standard deviation too
A standard error is the standard deviation of an estimate. If you could replay a season many times, a team’s win percentage would bounce around from run to run. The standard error measures how much.
That means the z-score formula works for estimates too:
z = (estimate - reference) / SE
In our post on how many bets you need, the bar was “expected profit 2 standard errors above zero.” That is just z = 2. On a normal curve, 97.7% of values sit below z = 2.
The standard error also tells you how much of a season’s z-score could be luck. For a team that is truly .500, the standard error of its win percentage over a season is:
SE = sqrt(.5 x .5 / games)
| League | Games | Spread of records (sd) | Coin-flip SE | SE / sd |
|---|---|---|---|---|
| NBA | 82 | .150 | .055 | 0.37 |
| NFL | 17 | .186 | .121 | 0.65 |
| NHL | 82 | .108 | .055 | 0.51 |
| MLB | 162 | .077 | .039 | 0.51 |
Worked for the NFL: .5 x .5 = .25, then .25 / 17 = .0147, and the square root of .0147 is .121.
In the NFL, luck alone moves a .500 team’s record by about .121 in one season, which is about two-thirds of the whole spread of records. So a single NFL season’s z-score mixes real team strength with a lot of chance. In the NBA, where 82 games and a wide spread work together, the coin-flip noise is only about a third of the spread.
How to use z-scores well
Take the mean and sd from the right group. A z-score is a position inside one group. Use the same league, the same stat and similar season lengths. Mixing a 17-game season with an 82-game season in one group would blend two very different spreads.
Check the shape before you use the lookup table. The z to percentile table assumes a bell curve. Skewed or fat-tailed data, like run margins or betting results, need real percentiles counted from the data.
Mind the sample. The more games behind a number, the more of its z-score reflects the team rather than luck. One 17-game NFL season is a thin sample.
Use it in models. Standardizing inputs means subtracting the mean and dividing by the sd, which is exactly a z-score. It puts points, goals and runs on one scale before fitting, so no input dominates just because its units are bigger.
Read it as a position, not a verdict. A z of +2 says where a value sits. It does not say why it got there or whether it will stay there.
Method notes
- Data: the bayesRatings game database (ESPN finals), regular seasons only. NBA and NHL 2021-22 to 2025-26, NFL 2021 to 2025, MLB 2022 to 2026.
- Club teams only. NHL All-Star and 4 Nations games are left out, and so is the NBA Cup final, which does not count in the standings.
- Win percentage counts ties (NFL) as half a win, and NHL wins include overtime and shootout wins.
- The mean and standard deviation are taken over all team seasons in each league’s five-season window. The sd is the population sd. The sample sd differs by less than .001 in every league.
- Single-game margins are home score minus away score, standardized within each league.
- This post describes how values are spread. It makes no claim about betting returns.