Home teams win more often in every major league. The edge is smaller than most people think, it differs by sport, and it is easy to measure badly. This post covers what the last five regular seasons show, why a single season tells you very little, and how a ratings model like bayesRatings adds home field to a matchup.
All game numbers come from the bayesRatings game database (ESPN finals). Regular seasons only, with neutral-site games left out. Ranges are 95% ranges from a normal approximation.
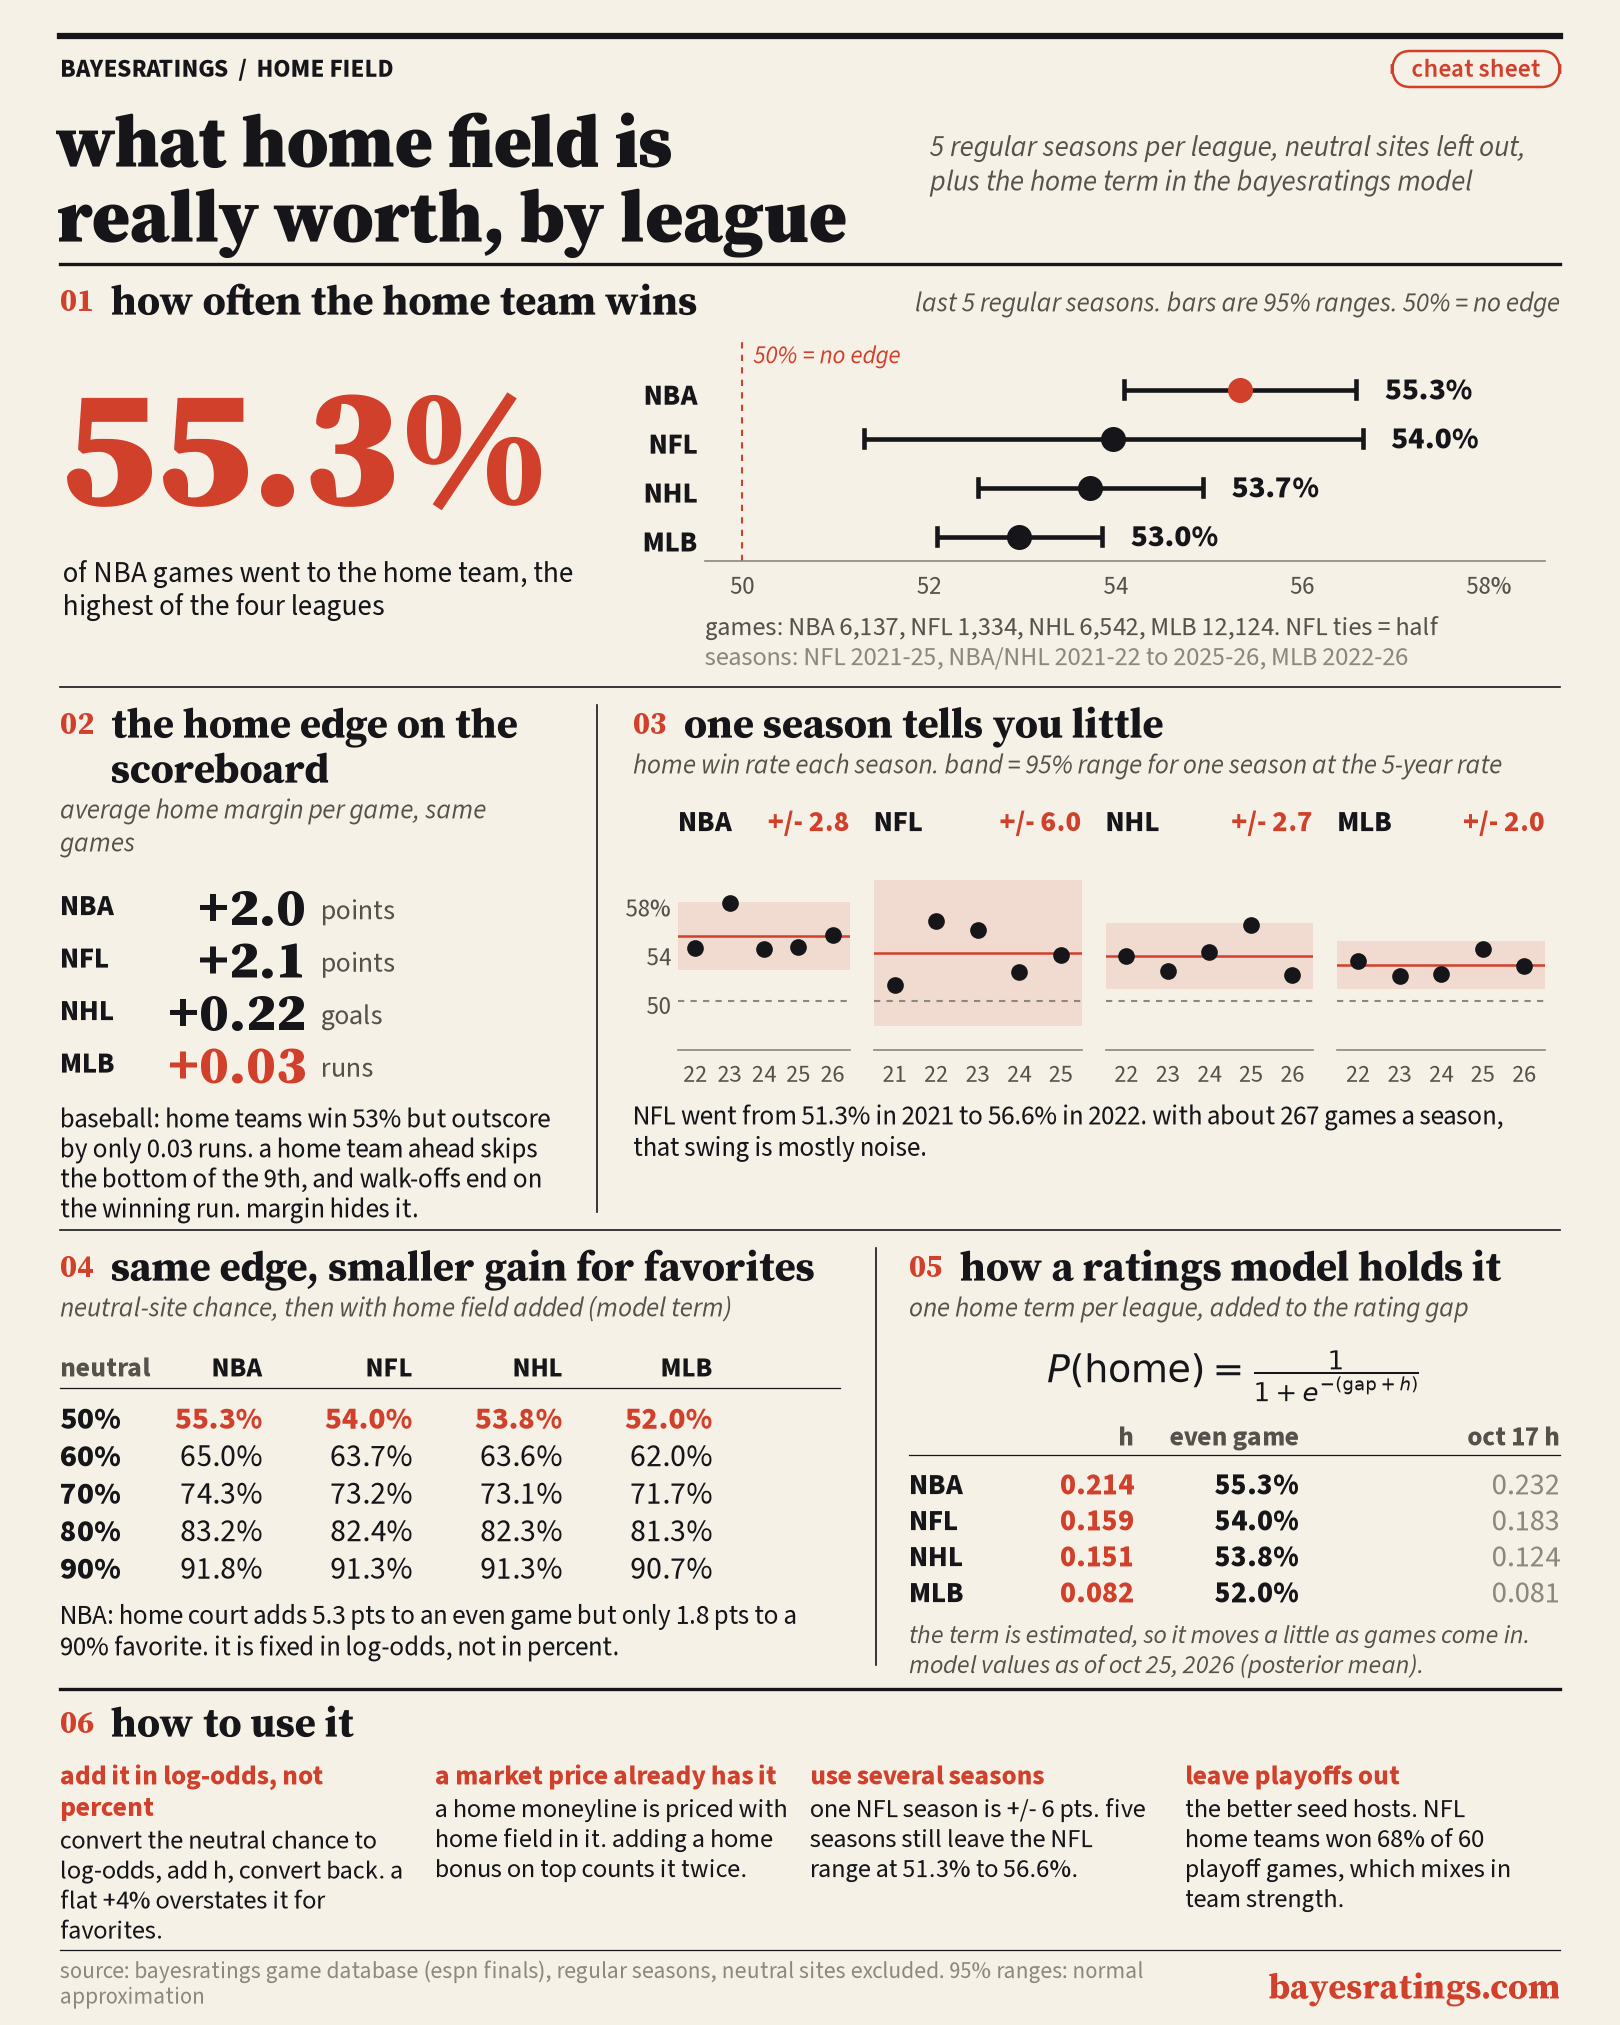
How often the home team wins
| League | Seasons | Games | Home win rate | 95% range |
|---|---|---|---|---|
| NBA | 2021-22 to 2025-26 | 6,137 | 55.3% | 54.1% to 56.6% |
| NFL | 2021 to 2025 | 1,334 | 54.0% | 51.3% to 56.6% |
| NHL | 2021-22 to 2025-26 | 6,542 | 53.7% | 52.5% to 54.9% |
| MLB | 2022 to 2026 | 12,124 | 53.0% | 52.1% to 53.9% |
NFL ties count as half a win (4 ties in this sample). NHL games count the overtime or shootout winner.
So the edge is 3 to 5 points above a coin flip in every league. The NBA has the biggest. Baseball has the smallest and the best-measured one, because it plays about nine times as many games as the NFL. The NFL range is the widest by far: over five seasons it still runs from 51.3% to 56.6%.
Older studies often quote bigger numbers. Scorecasting put the NBA at 62.7% and the NFL at 57.6%. The recent seasons sit below those. This post sticks to what the recent data shows and doesn’t try to explain the change.
The edge on the scoreboard
Average home margin per game, same games:
- NBA: +2.0 points
- NFL: +2.1 points
- NHL: +0.22 goals
- MLB: +0.03 runs
Baseball is the odd one. Home teams win 53% of games but outscore visitors by only 0.03 runs a game. The rules cap the home margin: a home team that leads after the top of the 9th doesn’t bat again, and a walk-off ends the game as soon as the winning run scores. Home teams win a bit more often without running up the score, so margin hides the edge in MLB.
One season tells you very little
Each season’s home win rate moves around a lot, and most of that movement is noise. At the five-year rate, the 95% range for a single season is:
- NFL: about 267 games, plus or minus 6.0 points
- NBA: about 1,228 games, plus or minus 2.8 points
- NHL: about 1,308 games, plus or minus 2.7 points
- MLB: about 2,425 games, plus or minus 2.0 points
The NFL went from 51.3% in 2021 to 56.6% in 2022. That looks like a big change, but both seasons sit inside the range you’d expect from luck alone around a 54% rate.
To pin a home win rate down to plus or minus 2 points, you need about 2,400 games. That is about one MLB season, about two NBA or NHL seasons, and about nine NFL seasons. It’s the same sample-size problem from How many bets do you need?, applied to a league instead of a bettor.
How a ratings model adds home field
The bayesRatings model gives each league one home term, called h. It is added to the rating gap between the teams before the gap is turned into a win chance:
P(home wins) = 1 / (1 + e^-(rating gap + h))
h lives in log-odds, the same scale as the ratings. Here is the value for each league as of October 25, 2026, and what it means for two evenly matched teams:
| League | h (log-odds) | Home chance, even game |
|---|---|---|
| NBA | 0.214 | 55.3% |
| NFL | 0.159 | 54.0% |
| NHL | 0.151 | 53.8% |
| MLB | 0.082 | 52.0% |
These are the model’s best single estimates (posterior means) as of October 25, 2026. h is estimated from the games in the model’s window, so it moves a little as new results come in. A week earlier, on October 17, the values were 0.232 for the NBA, 0.183 for the NFL, 0.124 for the NHL and 0.081 for MLB. The NFL and NHL terms are now close: 54.0% and 53.8% in an even game.
For the NBA, NFL and NHL, the current model term lands close to the five-season raw win rate above. MLB’s sits lower, 52.0% against 53.0%. The two don’t have to match. The raw rate is a five-season average. The model term is a current estimate that weights recent games more and adjusts for who played whom.
Same edge, smaller gain for favorites
Because h is fixed in log-odds, it is not a fixed number of percentage points. It adds the most to an even game and less as the matchup gets lopsided.
| Neutral-site chance | NBA | NFL | NHL | MLB |
|---|---|---|---|---|
| 50% | 55.3% | 54.0% | 53.8% | 52.0% |
| 60% | 65.0% | 63.7% | 63.6% | 62.0% |
| 70% | 74.3% | 73.2% | 73.1% | 71.7% |
| 80% | 83.2% | 82.4% | 82.3% | 81.3% |
| 90% | 91.8% | 91.3% | 91.3% | 90.7% |
Model values as of October 25, 2026.
In the NBA, home court adds 5.3 points to an even game but only 1.8 points to a team that would be a 90% favorite on a neutral floor. A flat “+4% for the home team” rule overstates home field for big favorites and slightly understates it for even games.
To add home field yourself:
- Turn the neutral-site chance into log-odds: ln(p / (1 - p)).
- Add h.
- Turn it back: 1 / (1 + e^-x).
Going the other way removes it. An NBA home team at 70% (with the vig taken out) is about a 65.3% team on a neutral floor: ln(0.7 / 0.3) = 0.847, minus 0.214 is 0.633, and 1 / (1 + e^-0.633) is 0.653.
Three mistakes to avoid
Counting it twice. A home team’s moneyline is already priced with home field in it. If you start from a market price and add a home bonus, you have counted home field twice. Add h only to a neutral-site estimate.
Reading the playoffs as home field. In the playoffs, the better seed hosts. NFL home teams won 68% of 60 playoff games in this window, and NBA home teams won 58% of 422. That mixes in team strength, so leave the playoffs out when measuring home field.
Trusting one season. One NFL season is plus or minus 6 points. A team or league that looks like it “lost” home field in one season usually hasn’t. Look at several seasons, or use a model that estimates h from many games and keeps updating it.
Summary
- Home teams win 53% to 55% of regular-season games across the four leagues.
- The NBA edge is the largest, MLB’s the smallest, and the NFL’s the least certain.
- One season is too short to measure it, especially in the NFL.
- A ratings model adds home field in log-odds, so it is worth more in an even game than for a heavy favorite.
- Market prices already include it.
You can see the home term at work in every forecast on the NBA, NFL, NHL and MLB pages.