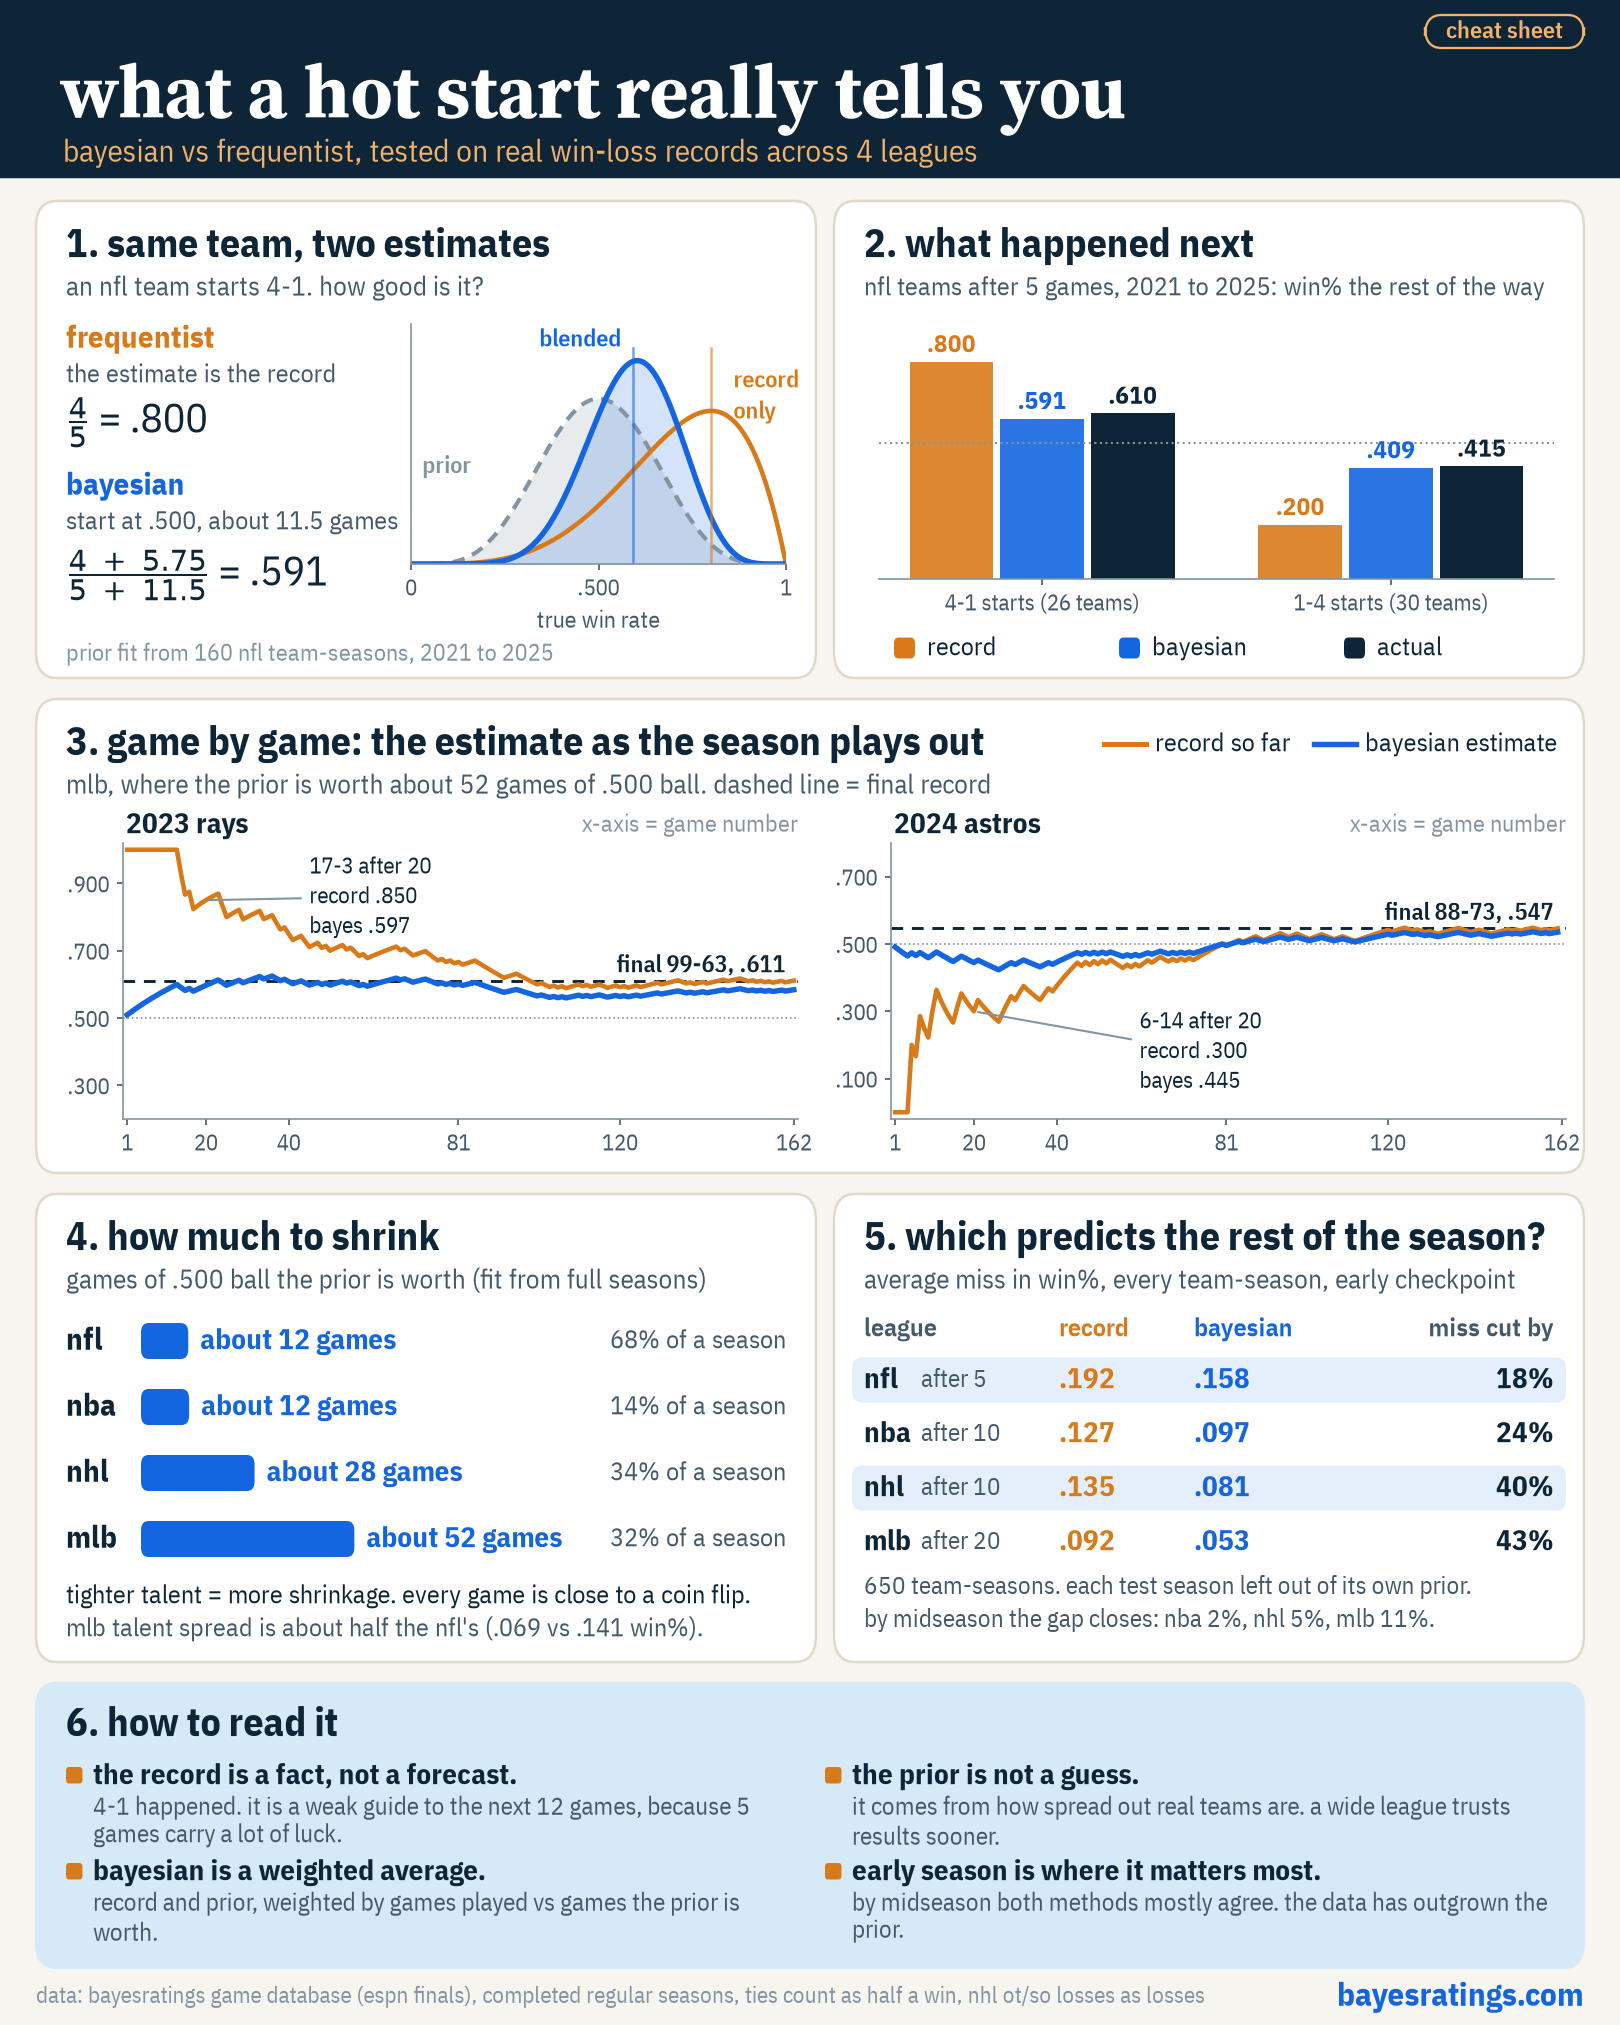
An NFL team starts 4-1. Its record says it is an .800 team, but teams that started 4-1 over the last five seasons won .610 of their games the rest of the way.
That gap is the whole difference between a frequentist estimate and a Bayesian one. Below we walk through both and test each on real NFL, NBA, NHL and MLB seasons.
Everything below comes from the bayesRatings game database: ESPN final scores, completed regular seasons only, with all-star and other exhibition games removed. NFL ties count as half a win. NHL overtime and shootout losses count as losses.
Two answers to the same question
The simplest frequentist answer is the record. The team won 4 of 5, so the estimate is 4/5 = .800. It uses only this team’s games and nothing else.
The Bayesian answer starts with what we already know about NFL teams in general, then updates it with this team’s 5 games. That starting point is called the prior. The blend of the prior and the data is called the posterior.
For a 4-1 NFL team:
- Record: 4 / 5 = .800
- Bayesian: (4 + 5.75) / (5 + 11.5) = .591
Where the prior comes from
The prior is not a hunch. It comes from how spread out real NFL teams are.
Across 160 NFL team-seasons from 2021 to 2025, full-season win% had a spread (standard deviation) of .186. Part of that spread is luck. Even if every team were exactly a .500 team, a 17-game season would still produce a spread of about .121 from coin-flip variation alone.
Luck and talent add up as variances, not as spreads, so we subtract the squares: .186 squared minus .121 squared leaves a true talent spread of about .141.
A prior centered on .500 with a spread of .141 works out to be worth about 11.5 games of .500 ball. Half of that is about 5.75 wins. So the Bayesian estimate is just the team’s record with about 5.75 wins and 5.75 losses added on top.
Shrinkage is a weighted average
This is called beta-binomial shrinkage. The name sounds heavy, but the idea is simple. The estimate is a weighted average of two things:
- the team’s own record, weighted by games played
- .500, weighted by how many games the prior is worth
After 5 games, the record has a weight of 5 and the prior has a weight of 11.5. The prior still wins the tug of war, so the estimate stays close to .500. After a full 17-game season, the record outweighs the prior, and the estimate moves past halfway (about 60% of the way) toward the record.
Small samples get pulled toward the league average. Large samples mostly speak for themselves.
The test: what happened next
If the Bayesian number is better, it should be closer to what teams actually did after their start. Here are NFL teams after 5 games, 2021 to 2025:
| Start | Teams | Record says | Bayesian says | Actual rest of season |
|---|---|---|---|---|
| 4-1 | 26 | .800 | .591 | .610 |
| 1-4 | 30 | .200 | .409 | .415 |
The record missed by .190 and .215. The Bayesian estimate missed by .019 and .006.
The 4-1 teams were still good, just not .800 good. The 1-4 teams were below average, but nowhere near .200.
How much to shrink depends on the league
Every league gets its own prior, fit the same way from its own full seasons. Prior strength is the number of .500 games the prior is worth:
| League | Seasons | Prior worth (games) | Share of a season |
|---|---|---|---|
| NFL | 2021 to 2025 | about 11.5 | 68% |
| NBA | 2021-22 to 2025-26 | about 12 | 14% |
| NHL | 2021-22 to 2025-26 | about 28 | 34% |
| MLB | 2021 to 2026 | about 52 | 32% |
One thing drives the number: how far apart teams really are. A single game is close to a coin flip in every league, so the tighter the true talent spread, the more games it takes before a record means something.
These are estimates, not exact constants. Resampling the team-seasons, the NFL value lands roughly between 9 and 16 games, the NBA between 10 and 15, the NHL between 23 and 36, and MLB between 42 and 69.
The NBA and NFL have a wide talent spread (about .140 in both), so results start to mean something quickly. MLB has the tightest talent spread (.069, about half the NFL’s), so a single baseball game is closer to a coin flip and a baseball team needs about 52 games before its record carries as much weight as the prior. The NHL sits in between.
Game by game: the 2023 Rays and 2024 Astros
The prior matters most when a start is extreme. Two MLB examples:
- 2023 Rays: started 17-3. Record said .850. Bayesian said .597. They finished 99-63 (.611).
- 2024 Astros: started 6-14. Record said .300. Bayesian said .445. They finished 88-73 (.547).
From game 20 to the end of the season, the Rays’ record swung between .589 and .870. Their Bayesian estimate stayed between .560 and .625. The Astros’ record ranged from .269 to .548 over the same stretch, while the Bayesian estimate stayed between .423 and .536.
After those 20-game starts, the Rays went .577 the rest of the way and the Astros went .582. The team that looked like a juggernaut and the team that looked lost played at almost the same rate for the next 140 or so games.
Which one predicts the rest of the season better?
To test this fairly, we checked every team-season at an early point in the year and compared each estimate to that team’s win% the rest of the way. Each test season was left out when fitting its own prior, so the prior never saw the answers.
| League | Checked after | Team-seasons | Record miss | Bayesian miss | Miss cut by |
|---|---|---|---|---|---|
| NFL | 5 games | 160 | .192 | .158 | 18% |
| NBA | 10 games | 150 | .127 | .097 | 24% |
| NHL | 10 games | 160 | .135 | .081 | 40% |
| MLB | 20 games | 180 | .092 | .053 | 43% |
“Miss” is the average gap between the estimate and the actual rest-of-season win%, across 650 team-seasons in total.
The Bayesian estimate missed by less in all four leagues. The biggest gains came in MLB and the NHL, the two leagues with the strongest priors.
By midseason the gap mostly closes. At the halfway point, the miss is cut by only 2% in the NBA, 5% in the NHL and 11% in MLB. Once a team has played enough games, the data outgrows the prior and the two methods mostly agree.
How bayesRatings uses the same idea
The bayesRatings model is a Bayesian Bradley-Terry model fit in Stan. It is more detailed than the cheat sheet version, but the core idea is the same.
- Every team’s rating starts from a shared prior centered on league average. The spread of that prior is learned from the data, the same way the 11.5 games came from real seasons above.
- It uses scoring margins, not just wins and losses, so a blowout moves a rating more than a one-point win.
- It weights recent games more than older ones, so the ratings follow teams as they change during the season.
So when a team opens with a run of big wins, the model pulls its rating back toward the pack in the same way the 4-1 team got pulled from .800 to .591. Think of the simple version in this post as the intuition behind the full model.
Limits of this version
- Wins and losses only. No margins, no shot quality, nothing beyond the result.
- No schedule adjustment. A 4-1 start against weak teams counts the same as one against strong teams.
- No roster news. Injuries, trades and preseason expectations are ignored. Information like that would make a stronger prior than a flat .500.
- Small groups. The 4-1 and 1-4 groups are 26 and 30 teams. The 5-0 and 0-5 groups were too small to report.
- The .591 and .409 prior was fit on the same 2021 to 2025 seasons it is tested on. The accuracy table above avoids this by leaving each test season out of its own prior.
None of this makes the frequentist record wrong. It is a fact about what happened. It is just a weak guide to what comes next when the sample is small, and that is exactly where a prior helps.